
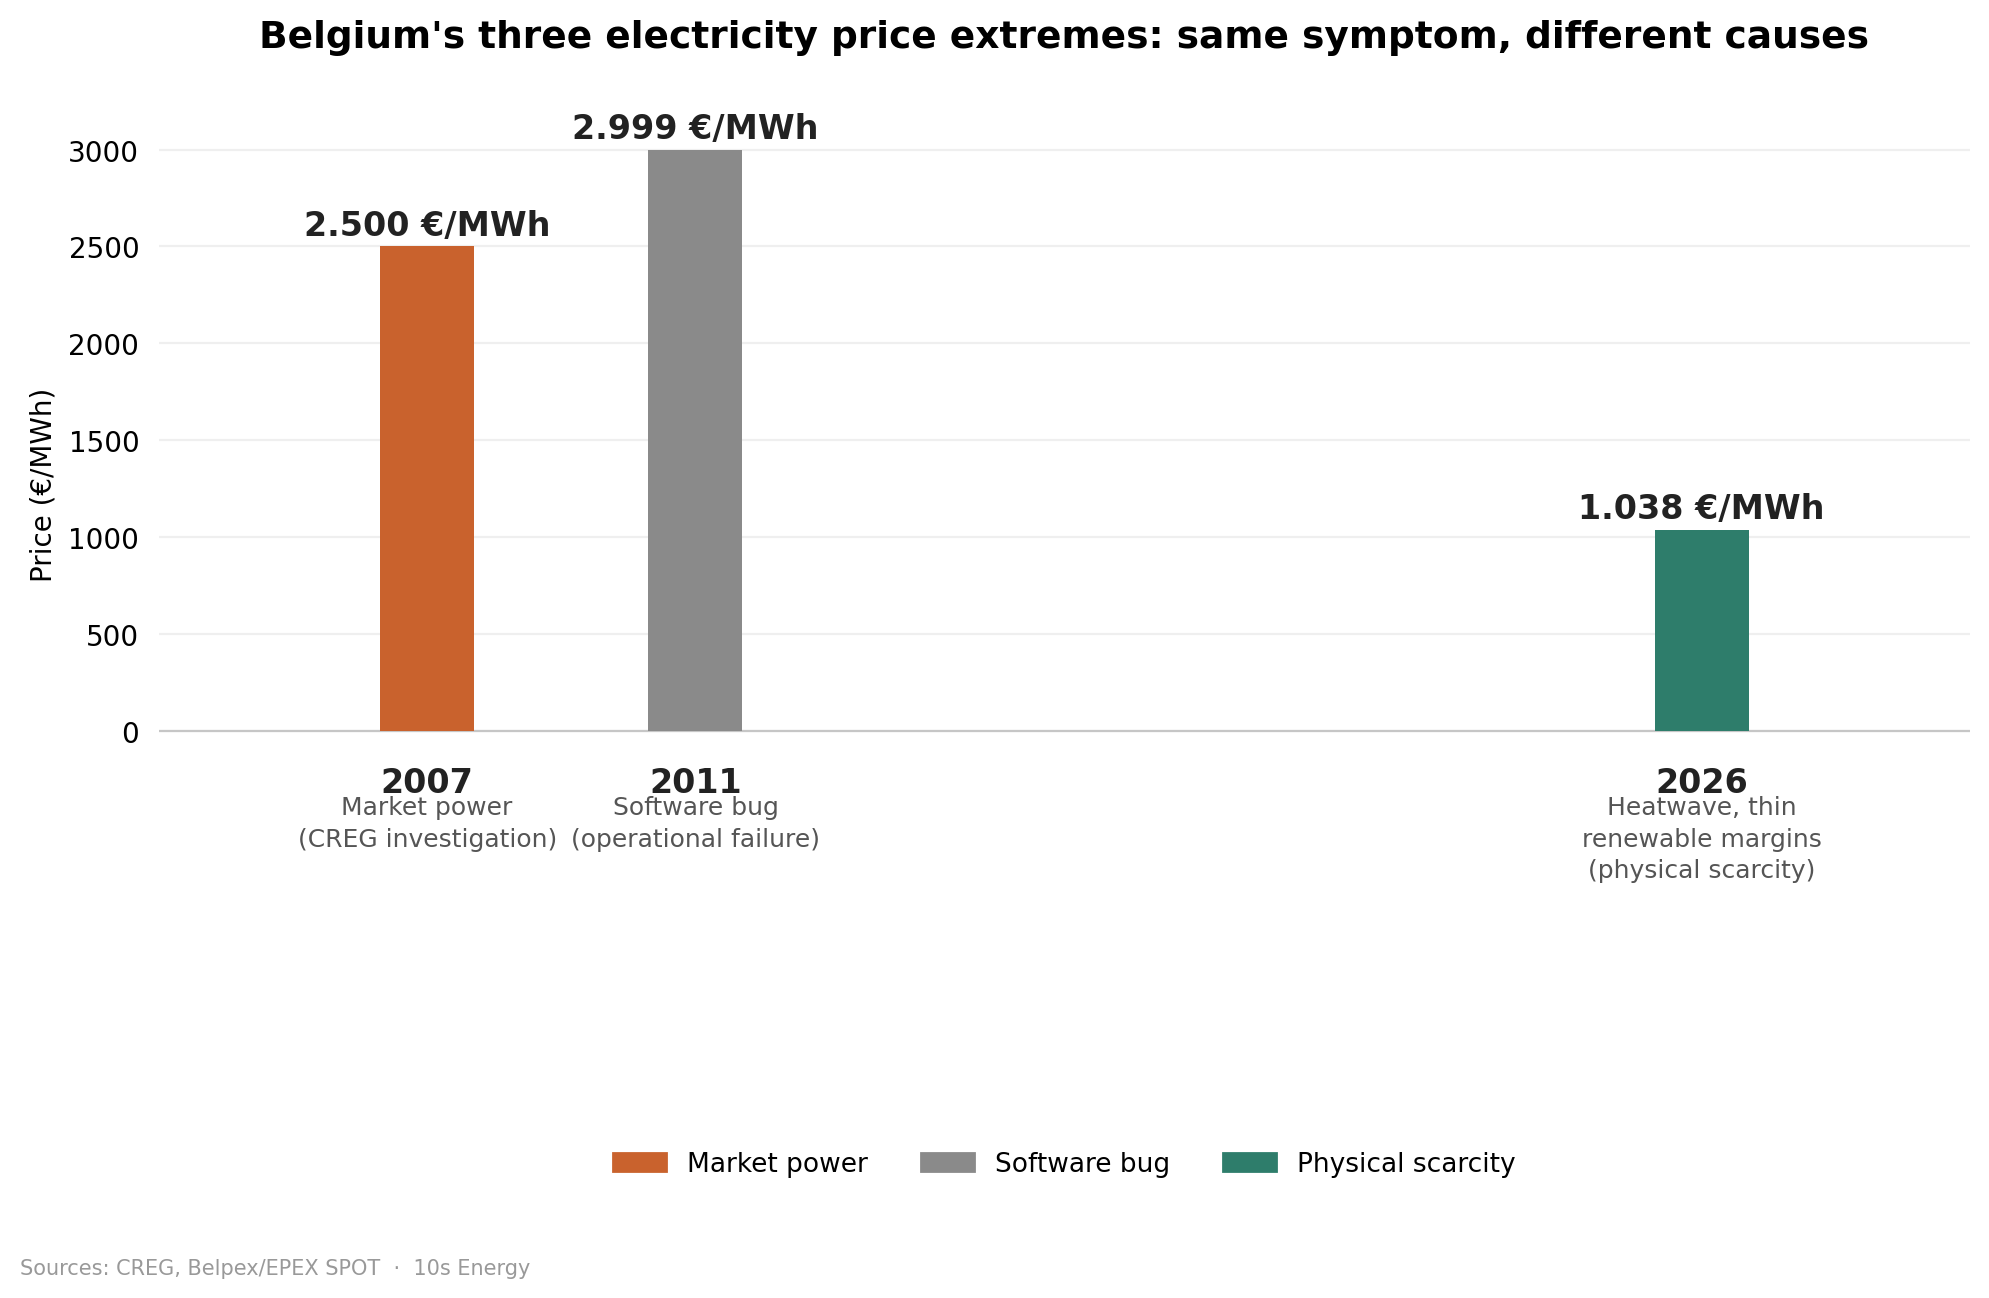
On the evening of 24 June 2026, somewhere inside the algorithms that clear Belgium's day-ahead electricity market, a single 15-minute window came back with a price of 1.038,25 €/MWh. By the standards of an ordinary summer evening, that number is almost absurd, something closer to a typo than a tariff. Within hours it was being reported as the highest price the Belgian market had produced since 2011, when a software bug sent prices briefly spiralling to 2.999 €/MWh, an anomaly so strange it's still cited as a cautionary tale fifteen years later.
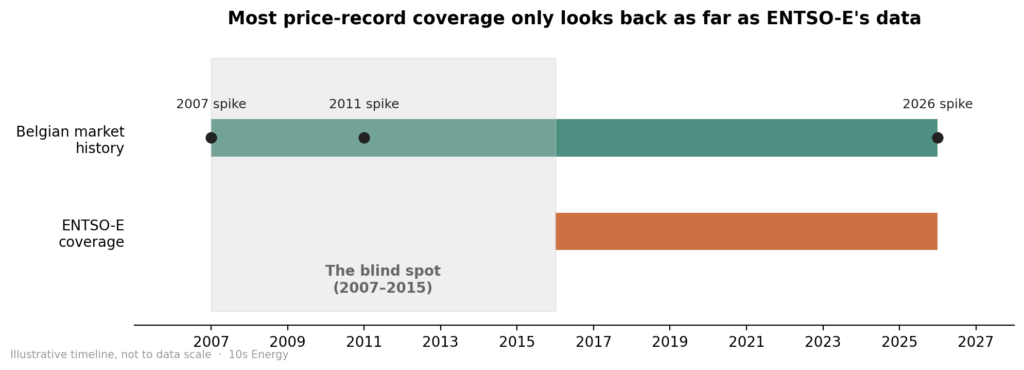
It's a good story, and it's true as far as it goes. It's also, as it turns out, not quite the whole story, because the comparison only works if you believe the Belgian electricity market started existing in 2016. A great many of the people writing and reading about Tuesday's record believe exactly that because the database almost everyone reaches for, ENTSO-E's transparency platform, only goes back that far with anything like reliable hourly granularity. It's an extraordinary resource, and it has become the default lens through which an entire generation of energy journalists, analysts, and traders understands what "normal" and "extreme" look like on a European power market.
However, Belgium's electricity market didn't begin in 2016. It didn't even begin in 2011. To understand what Tuesday's record actually means, and what it doesn't, you have to go back further than the data most people are looking at, to a market that was younger, smaller, far more concentrated in the hands of a single company, and considerably less transparent about how its prices were actually being set.
A market still finding its feet
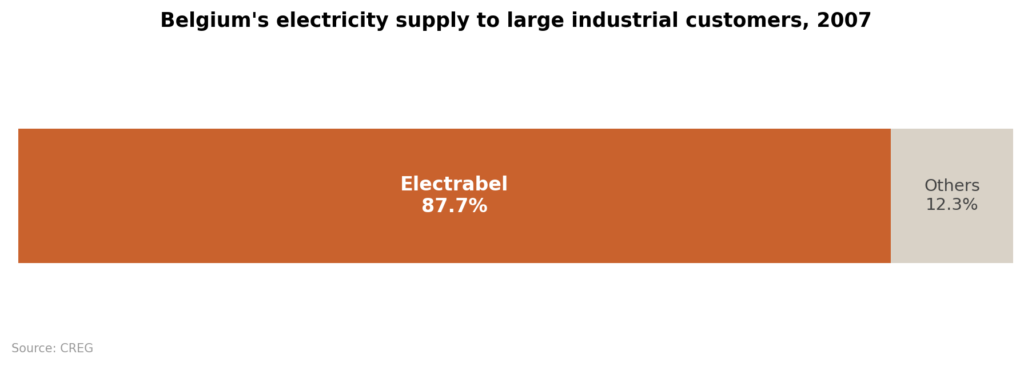
Belgium fully liberalised its electricity market in 2007, the year new entrants like Eneco, Essent, and Lampiris were first able to offer products to Flemish and Walloon households alongside the incumbent. On paper, this was the moment Belgium joined its neighbours in having something resembling a competitive power market. In practice, one company still controlled the overwhelming majority of the country's generation capacity. Electrabel's share of supply to large industrial customers connected to the federal transmission grid sat at roughly 87.7% that year, a figure CREG, Belgium's energy regulator, published without much editorial comment, because the number itself was the comment.
It was into this still-lopsided market that a string of unusually sharp price spikes arrived in 2007, in May, October, November, and December, followed by further spikes in April and May of 2008. They were significant enough, and frequent enough, that CREG opened an investigation into the behaviour of the Belgian electricity exchange across that period, formally approving its findings in a study dated 7 May 2009. What that study looked at, in essence, was whether the buying behaviour of the market's dominant player tracked, and perhaps deepened, periods when nuclear output was falling, the kind of pattern that, if deliberate, starts to look less like a market responding to scarcity and more like a market being made scarce.
Three spikes, three different stories
What makes the comparison across 2007, 2011, and 2026 worth making isn't the size of the numbers, impressive as they are. It's that each spike, on the surface a near-identical symptom, a chart with a line shooting somewhere it has no business going, turns out to have an entirely different disease behind it.
In 2007, following the investigation by the CREG, the market was behaving the way a market behaves when one participant holds enough power to bend it. This was the very beginning of the power market, in which competition, bidding processes, traders, generators and consumers were all still learning how this could work. In 2011, the cause was mechanical: a piece of software did something it wasn't supposed to do, briefly and catastrophically, and the market dutifully cleared at a price that reflected a glitch rather than anything happening in the physical world. This week's spike is different again, and in a sense the most honest of the three: a heatwave settling over Belgium and much of central and western Europe pushed demand up at exactly the hours when solar output was already falling toward evening, and with wind contributing little, the grid simply didn't have enough flexible supply on hand to meet the moment without asking someone to pay a price steep enough to either bring more generation online or persuade some of that demand to wait.
That distinction, between a market failing and a market working exactly as designed under genuine physical stress, matters more than the headline figure does. A price spike caused by manipulation is a story about regulation and enforcement, about whether the rules of the market are being followed and whether anyone is watching closely enough to know if they aren't. A price spike caused by a software bug is a story about operational resilience, about the unglamorous plumbing that has to work correctly for a market to function at all. And a price spike caused by a genuine, weather-driven supply crunch is a story about physics, about a grid that is becoming more dependent on a generation mix that doesn't always show up when you need it most.
Only the third kind of spike is one that a household, or a piece of automation acting on a household's behalf, can do anything meaningful about. You cannot out-think market manipulation by shifting your dishwasher to a different hour, and you certainly can't out-think a software bug. What you can do something about is the third kind: a grid that's telling you, in close to real time, that supply is tight right now and will likely be more comfortable in a few hours.
Why the data only goes back so far
It's worth pausing on why ENTSO-E's records start where they do, because the answer says something about how recently European power markets became the kind of transparent, harmonised system that makes a record like Tuesday's even legible to the public in the first place. ENTSO-E itself, the association of European transmission system operators, only began consolidating detailed, standardised price and generation data across the continent into a single public platform in the years following 2015, as part of a broader regulatory push for market transparency under European law. Before that, the data existed, but it lived in fragmented form across national exchanges and regulators, in formats that didn't always agree with each other, in PDFs rather than databases, in annual reports rather than APIs.
That's not a criticism of ENTSO-E, whose transparency platform represents a genuine and significant improvement over what came before it. It's simply a reminder that "the data we have" and "the history that happened" are not the same thing, and that the gap between them tends to be invisible right up until a number like 1.038,25 €/MWh sends everyone scrambling for context, and the easiest context to find becomes, by default, the only context anyone reports.
What the longer history tells you
Once you put 2007, 2011, and 2026 next to each other, a more useful pattern emerges than the one suggested by any single record. Roughly once every seven to eight years, for entirely different reasons each time, the Belgian market has produced a price extreme severe enough to make headlines. That's not evidence that the system is fragile in some constant, unchanging way. It's evidence that a market this size, this interconnected, and increasingly this exposed to weather, will periodically be tested by something, and that the something keeps changing. Market power was the story in 2007. Operational failure was the story in 2011. Physical scarcity, the kind that comes from building an electricity system around a fuel source that occasionally just doesn't show up, was the story this week.
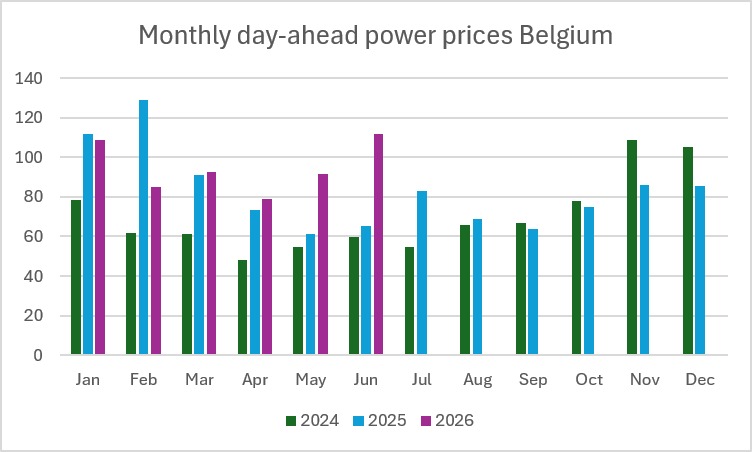
The physical scarcity kind is also the kind most likely to keep recurring, and to recur more often than once a decade, as Belgium and its neighbours keep adding wind and solar capacity without yet building enough flexible generation, storage, and demand response to absorb the swings that intermittent generation produces. That's not a reason to be alarmed about renewables. It's a reason to expect more days like this one, on a timeline considerably shorter than the gaps between 2007, 2011, and 2026, and to think carefully about which households are positioned to do something useful when those days arrive, and which households simply absorb whatever the day decides to charge them, sometime later, dressed up as an indexation adjustment they never get the chance to question.
That's ultimately the question worth sitting with longer than the number itself. Tuesday's record will be beaten again, probably sooner than anyone expects, by another heatwave, another cold snap, another stretch of still, grey weather that leaves the grid short of options. When it happens, the interesting question won't be how high the number went. It'll be how many households saw it coming, and how many simply paid for it without ever being asked.
10s Energy connects real-time Elia balancing prices to Home Assistant, so EVs, heat pumps, and batteries can respond automatically to genuine grid scarcity, rather than a household finding out about it after the fact, on a bill.