
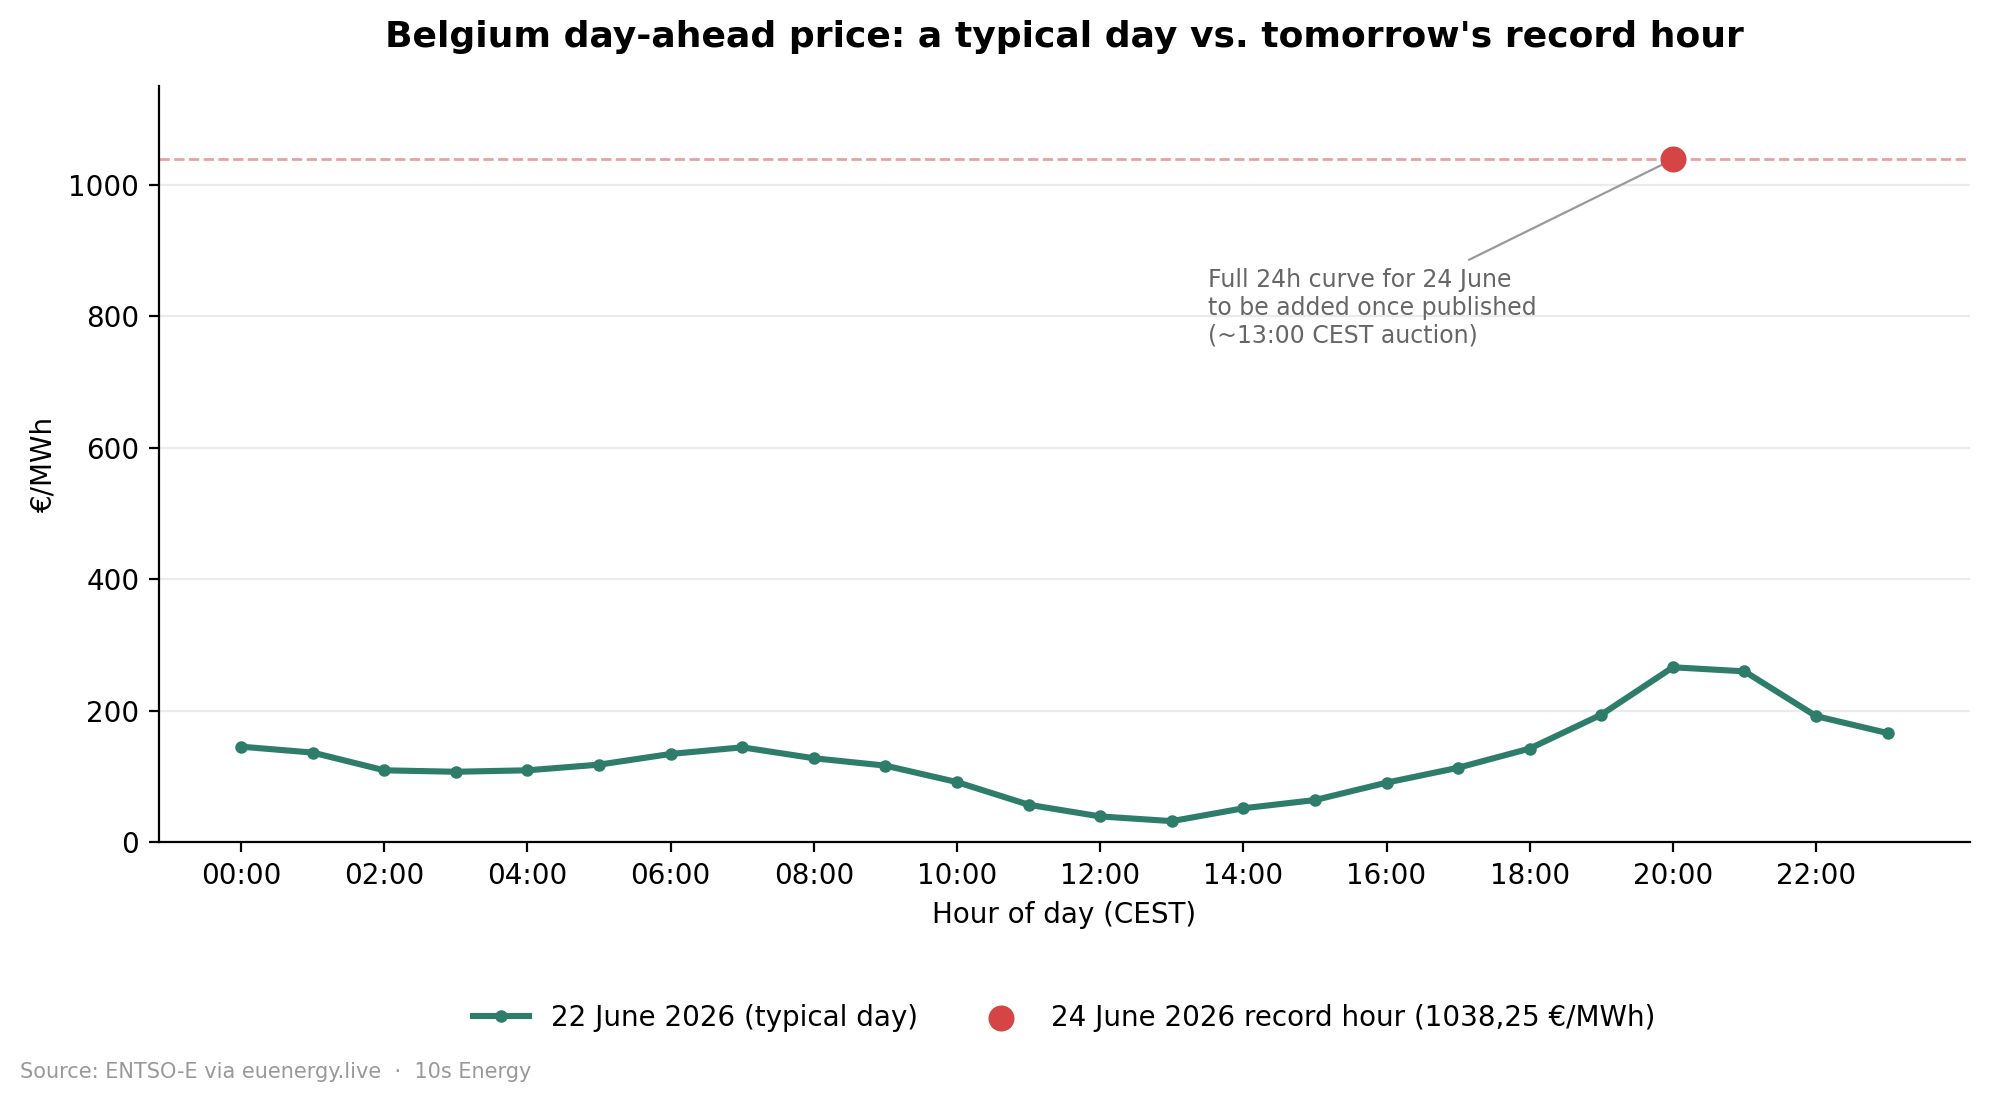
Belgium's day-ahead power market printed an all-time high on Tuesday: 1.038,25 €/MWh for the 15-minute window starting at 20:45 CEST on Wednesday 24 June. To find a comparable Belgian price, you have to go back to 28 March 2011, when a software error briefly pushed the market to 2.999 €/MWh. This time, the cause isn't a glitch. It's heat, demand, and a grid running close to its limits.
What actually happened
Belgian baseload power for Wednesday delivery settled at 257 €/MWh, up roughly 73 €/MWh on the day. That's the headline average. The 1.038,25 €/MWh figure sits inside that average, attached to a single 15-minute window in the early evening, the point at which a heatwave-driven demand peak overlapped with a drop in available wind and solar generation.
Belgium wasn't alone. Germany, Europe's largest power market, set its own 15-minute record on the same day at 747,10 €/MWh, with baseload reaching 207,94 €/MWh, the highest level recorded there since late November. The Netherlands saw a 15-minute price of 902,47 €/MWh, and Denmark's DK1 zone reached 786,83 €/MWh, both extending records that had already been set the day before. Across the board, the pattern is the same: a heatwave currently sitting over central and western Europe, with forecasters expecting it to persist into early July, is pushing demand up at the end of the day when solar generation is winding down for the evening and wind contribution is low.
The technical term for the gap this creates is residual load: the share of demand that wind and solar can't cover, left for conventional generation, imports, and storage to fill. When residual load spikes like that, the market clears at whatever price is needed to bring enough generation online, or enough demand offline, to balance the grid in real time. On Tuesday, that price was four to five times the typical summer evening rate.
Why this keeps happening, and will keep happening
None of this is a one-off. As more of Belgium's and Europe's generation mix shifts toward wind and solar, the hours when that generation is abundant get cheaper, sometimes into negative territory, and the hours when it isn't get more expensive, because there's comparatively less flexible, dispatchable capacity sitting in reserve to absorb the gap. A heatwave is a clean trigger because it pushes demand up (cooling, refrigeration, industrial load) at the same time solar output is falling toward evening. But the underlying mechanic, a grid with thinner margins at the edges of the day, doesn't need a heatwave to show up. It shows up on any day where weather, demand, and available capacity line up badly.
That's the part that doesn't make it into most headlines: volatility like Tuesday's isn't a temporary side effect of the energy transition that will smooth out once more renewables are built. It's closer to a permanent feature of a grid with a high renewable share. The hours will keep getting more extreme in both directions, not just the expensive ones.
Who actually pays for an hour like this
This is where the story usually gets told incompletely. The standard framing is that dynamic-rate households feel an hour like 20:45 on Wednesday directly, while everyone else doesn't. That's true in the narrowest sense, and it's also misleading, because it implies the cost simply disappears for households on indexed or fixed contracts. It doesn't disappear. It gets paid by someone, somewhere in the system, and it eventually lands back on the household, just on a different schedule and through a different mechanism.
Indexed contracts pass wholesale costs through on a delayed basis, smoothed over a billing period or a quarterly review, folded into a formula most customers never look at closely. Fixed contracts build an assumption about average wholesale costs, including spikes like this one, into the price the supplier quotes upfront, which is part of why fixed prices in a more volatile market tend to carry a larger risk margin than they used to. Either way, an hour like Tuesday's record gets paid for. The only question is whether the household paying for it ever had the chance to do anything differently because of it.
That's the actual distinction between contract types, and it has nothing to do with bravery or risk tolerance. A household on a dynamic contract sees the price before it happens, because day-ahead prices are published in advance, and can choose, or automate, its way around the expensive hours. A household on an indexed or fixed contract has no equivalent decision point. The cost arrives regardless of what the household does, because the contract was never built to let usage respond to price in the first place.
What "responding to price" looks like in practice
In concrete terms, avoiding an hour like Wednesday's 20:45 window doesn't require sitting at a laptop watching a price chart. It requires a contract that exposes the price signal, plus automation that can act on it without a person in the loop. For a household with that setup:
- An EV due for a full charge shifts to overnight hours, or to whichever windows the imbalance price happens to be cheapest or negative, rather than charging on schedule regardless of price.
- A heat pump pre-conditions the home ahead of an expected peak and avoids cycling on during it, so the household barely notices the price spike happened.
- Batchable loads, washing machines, dishwashers, dryers, tumble for a few hours later instead of running at peak demand.
None of those decisions are dramatic on their own. The 1.038,25 €/MWh figure is the kind of number that makes a news story, but the mechanism that actually protects a household from it is closer to invisible: a thermostat that waited, a charger that started two hours later than usual, a dishwasher that ran overnight instead of after dinner.
Why this matters more than one record number
A single record price is a useful news hook, but it understates the pattern. Days like Tuesday will recur, driven by heatwaves, cold snaps, low-wind stretches, or simple demand peaks that happen to coincide with thin renewable output. At the same time, the same grid dynamics that produce these spikes also produce an increasing number of very cheap, and occasionally negative, hours when wind and solar output outpaces demand. The wider that spread gets between the cheapest and most expensive hours of the day, the more there is to gain, or lose, depending on whether a household's contract lets it respond.
That's the actual stakes of the contract-type question, independent of any single price record. It isn't about whether a household can tolerate a dramatic headline number. It's about whether the structure of the contract gives the household, or its automation, the ability to act on the price signal at all.
The choice, stated plainly
Every household in Belgium pays for an hour like Wednesday's record, one way or another. Indexed and fixed contracts pass that cost through quietly, later, without asking the household anything. Dynamic contracts surface the cost before it happens, and leave room for the household, or its automation, to do something about it.
That isn't a footnote to Tuesday's news. It's the part of the story that's usually missing from it.
10s Energy connects wholesale market pricing to Home Assistant, so EVs, heat pumps, and major appliances shift themselves out of expensive hours automatically, without anyone needing to watch a price chart to make it happen.