
Grid infrastructure · Flanders · Deep dive
Published May 2026 · Reading time: ~10 min · Sources: VREG, Fluvius, VNR, Flanders government
The capacity tariff didn't arrive from nowhere. It was decades in the making, and understanding its history tells you more about where it's going than any press release ever will.
Most people see "capaciteitstarief" on their electricity bill and either ignore it or somewhat blame the energy crisis. Both reactions miss the point. This tariff is a structural redesign of how distribution network costs are allocated, and it has consequences that will compound for the rest of this decade.
Let's go back to the beginning. Then let's talk numbers. Then let's talk about what's coming.
A brief history: it started in 1948
Capacity-based electricity pricing is not new. The oldest capacity meter in Fluvius' records dates back to 1948. From the mid-twentieth century onwards, large industrial consumers were billed partly on their peak demand in kilowatts rather than purely on consumption in kilowatt-hours. It made sense: a steel mill that draws 500 kW for an hour stresses the grid far more than a bakery drawing 5 kW for 100 hours, even if they consume the same total energy.
For households, none of this applied. Our appliances were modest, our consumption was predictable, and our load profile was manageable. The kWh tariff worked fine. Then everything changed at once. Solar panels started going on rooftops in large numbers. Heat pumps started replacing gas boilers. And then the electric vehicle wave arrived, a 7 kW home charger draws more power than a typical household previously consumed in a full evening. By the early 2020s, the morning and evening peaks on the Flemish low-voltage distribution network had become a structural problem.
"The difference between day and night consumption in Flanders amounts to some 3,000 megawatts. Practically as much as the output of four nuclear power plants."
The kWh era and why it had to end
Until 31 December 2022, grid distribution costs in Flanders were calculated almost entirely on the basis of total energy consumption in kWh. The problem is that the kWh metric doesn't capture grid stress. Someone who charges their EV and runs their heat pump and cooks dinner simultaneously in a 15-minute window hits the network like a sledgehammer, even if their total annual consumption is modest. Under the old regime, they paid the same grid distribution rate as their neighbour who spreads usage evenly all day. That's not just unfair, it's the wrong price signal entirely.
VREG (now rebranded as Vlaamse Nutsregulator, or VNR) spent several years studying the mechanics of a capacity-based tariff for households. The full introduction came into effect on January 1, 2023.
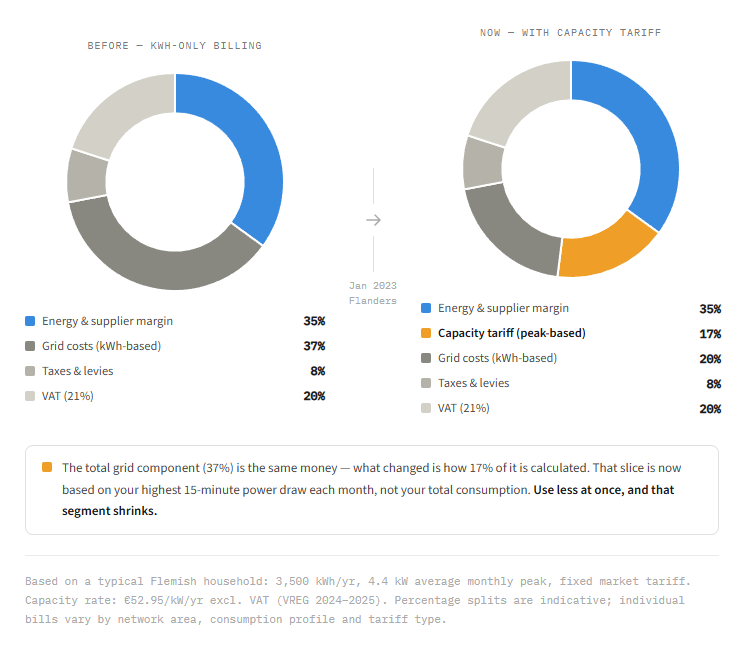
The total grid cost hasn't changed, but since January 2023, 17% of the average Flemish household's electricity bill is now billed based on peak power draw rather than total consumption. That's the part you can actively reduce.
How the mechanism actually works
For anyone with a digital (smart) meter, which by end-2025 was approximately 80% of Flemish households, the calculation runs like this:
// Step 1: each 15-minute interval
quarterly_peak (kW) = energy consumed in that interval (kWh) × 4//
// Step 2: worst quarter-hour of each month
monthly_peak (kW) = max(quarterly_peak) for the month
// Step 3: rolling 12-month average
avg_monthly_peak (kW) = mean(last 12 monthly peaks)
// Step 4: annual billing
capacity_cost (€) = avg_monthly_peak × tariff_rate (€/kW/year)
// Floor: minimum 2.5 kW regardless of actual behaviour
billable_peak = max(avg_monthly_peak, 2.5 kW)
The 2.5 kW minimum is a standing charge in disguise: everyone contributes to the network's existence even if they never draw much power. One important nuance: injection peaks from solar panels don't count. The capacity tariff is applied to offtake only.
4.24 kW
Average Flemish household monthly peak (VNR data, Nov 2025, 1M+ households)
This is what a typical family pays the capacity tariff on. Run the oven, the washing machine, and start charging the car simultaneously and you're well above this.
The price history: what you've actually been paying
The headline rate per kW is set annually. But total grid costs have moved for multiple reasons simultaneously, distinguishing between them matters.
Pre-2023
kWh only
No capacity component for households. Day/night tariff applied.
2024
€52.95 /kW/year (excl. VAT)
Avg. household ~€231/yr capacity cost. Total grid costs ~€363/yr.
2025
€52.95 /kW/year (excl. VAT)
Rate held flat. But total grid costs rose ~33% to ~€445/yr. See below.
2026
~€57.45 /kW/year (incl. VAT, Fluvius West region)
Slight rise. Avg. household at 4.2 kW pays ~€241/yr capacity component.
The 2025 tariff shock deserves a separate note, because it's commonly misattributed to the capacity tariff itself. It wasn't. The capacity tariff rate barely moved. What moved was the Elia transmission component — the high-voltage network costs that sit above Fluvius and get bundled into the total grid bill. Those rose by approximately 80% in 2025. The net effect: an average household paid roughly €82 more per year in grid costs in 2025 versus 2024, split roughly 50/50 between Elia and Fluvius.
The 33% grid tariff rise in 2025 was overwhelmingly caused by Elia's transmission costs (+80%), not the capacity tariff mechanism. Conflating the two is a very common error in media coverage.
The regional patchwork problem
One thing the average consumer doesn't immediately grasp is that "the capacity tariff" isn't a single number across Flanders. There are eight distribution network operators under the Fluvius umbrella, each with slightly different cost bases and tariff levels. The spread is significant: Fluvius West is around €101 more expensive per year than Fluvius Midden-Vlaanderen for an average electricity consumer. Your postcode matters.
This is set to change. The Flemish government has been pushing for a merger of the eight intercommunal companies that own the underlying network infrastructure into a single DSO structure, which would pave the way for a unified tariff across Flanders. It would eliminate the geographic lottery of network costs, though implementation timelines remain fluid.
For comparison: Wallonia moved in January 2026 to a dual time-of-use tariff (peak hours 7–11h and 17–22h). Brussels has had a capacity component since 2019. Belgium's three regions now have three structurally different approaches to grid cost allocation. Harmonisation is not imminent.
The solar problem, the contradiction at the heart of the tariff
Here is something the official communications don't say plainly: the capacity tariff contains a structural contradiction that becomes more serious every year as renewable generation grows.
The logic of the tariff is sound in one direction: by penalising simultaneous high loads, it discourages households from stressing the grid during morning and evening demand peaks. That's the behaviour it was designed to change. But the grid is no longer just a demand problem — it's increasingly a supply management problem too.
On a bright spring or autumn afternoon, residential and commercial solar panels across Flanders collectively generate far more electricity than local demand can absorb. The low-voltage grid struggles not because too many people are drawing power, but because too many panels are pushing it back. The grid operator's problem in that moment is the exact opposite of an evening peak: they need consumption to go up, not down.
And yet a household that decides to run the washing machine, charge the EV, and blast the heat pump simultaneously at solar noon — exactly the behaviour the grid needs — risks spiking their monthly peak and paying more in capacity tariff. The price signal points in precisely the wrong direction at precisely the wrong moment.
The capacity tariff was designed for a grid that needed less simultaneous consumption. It wasn't designed for a grid that sometimes desperately needs more of it.
This isn't a minor edge case. Negative wholesale electricity prices — periods when the market is paying consumers to absorb surplus generation — occurred on nearly 300 hours in Belgium in 2024, concentrated in spring and autumn. That number is rising. A tariff structure that discourages consumption during those windows is not just failing to capture an opportunity; it's actively working against the grid's operational needs.
This is widely understood within the regulatory and grid operator community. It is, quietly, one of the primary reasons the capacity tariff in its current form is unlikely to survive 2028 unchanged.
The investment imperative: why this isn't going away
The capacity tariff exists because Fluvius faces an investment obligation that is genuinely enormous. The Investment Plan 2026–2035, filed with the VNR, commits to approximately €11 billion over the decade: €7 billion in regular maintenance and renewal, plus €4 billion in additional network reinforcement to handle electrification. Between 2022 and 2024 alone, 6,500 kilometres of new low-voltage grid and 2,400 kilometres of new mid-voltage grid were already constructed, with 3,325 distribution cabins renewed or newly installed.
€11 billion
Fluvius network investment planned 2026–2035
Of which €4 billion is additional spend driven by the energy transition — EVs, heat pumps, solar, industrial electrification. That bill lands on tariffs.
There's a capital shortfall in the near term too. Fluvius faces approximately €1 billion of equity need by 2026, with an additional €560 million required by 2029. The Flemish government has indicated a willingness to invest up to €1.56 billion through Publi-T and direct shareholding in intercommunal companies to plug the gap. This is partly what's driving the governance consolidation push.
On the demand side, the 2026–2035 investment plan has been updated to reflect faster-than-expected industrial electrification, companies switching boilers and production processes from gas to electricity, alongside revised assumptions on EVs (1.6 million in Flanders by 2030, up from the 1.5 million estimate), and slower-than-expected heat pump uptake in residential renovation (only 611,000 electric heat pumps by 2035 is the current projection, due to the low 1% annual renovation rate and relaxed EPC requirements).
The roadmap: key inflection points through 2029
Early 2026
Final digital meter rollout phase begins. The remaining ~20% of connections (approximately 1.25 million electricity and gas meters) starts installation. These are predominantly analogue-meter customers without solar panels, many with older connections requiring more complex work. This matters because only digital meter holders get the full behavioural capacity tariff signal.
2026 onwards
Flexibility services on the distribution network scale up. Platforms for demand-side flexibility and smart charging coordination move from pilot to commercial deployment. The capacity tariff creates the incentive; these services provide the mechanism.
2027
Third-party data access opens up. Metering data from EV charging stations and other third-party devices becomes accessible via Fluvius (with customer consent). This enables much more granular energy management products and makes dynamic tariff offerings more commercially viable.
2028
"Supply split" becomes technically feasible. This is the big one for EV households: you'll be able to take out a second electricity contract on the same physical connection and digital meter, with different pricing terms for EV charging. Currently this requires a separate additional meter. Removing that requirement fundamentally lowers the cost of smart, time-differentiated EV tariffs.
End of 2028
Tariefmethodologie 2025–2028 expires. The current regulatory framework that governs what distribution operators can charge runs out. This is the natural window for a structural redesign of how grid costs are allocated, and it's widely expected to be used as one.
Mid-2029
Last analogue meters replaced. 100% digital meter coverage means 100% of households are on the actual measured capacity tariff rather than the 2.5 kW flat minimum. The behavioural pricing signal reaches its full population coverage.
What replaces it? The two models on the table
The post-2028 regulatory debate is already happening, even if it's not yet public. Two broad alternatives to the current structure are in serious discussion.
The first is a time-differentiated capacity rate — the same peak-based mechanism, but with the tariff rate set to zero (or near-zero) during high-solar, low-demand windows. A consumption peak at solar noon would cost nothing in capacity tariff. A peak during a cold January evening would cost the full rate. This preserves the fundamental incentive to avoid stressing the grid under demand pressure, while removing the perverse disincentive to consume during periods of renewable surplus. It is arguably the most technically elegant fix, but it requires significantly more sophisticated metering, forecasting, and communication infrastructure to implement at household level.
The second option is a return to kWh-based billing, but with time-of-use differentiation — higher rates during peak demand hours, lower rates off-peak or during high-generation windows. This is essentially what Wallonia chose when it reformed its grid tariff in January 2026: consumers there can now opt into a structure with defined peak (7–11h and 17–22h) and off-peak windows, with the off-peak rate low enough to incentivise shifting load. It is simpler to communicate to consumers, less dependent on real-time data infrastructure, and has a proven track record in other European markets. The trade-off is less precision: a flat overnight cheap rate doesn't distinguish between 3am (often cheap and clean) and 8pm (often expensive and dirty).
Neither outcome eliminates the underlying pressure on grid costs. The €11 billion investment plan runs to 2035. Whatever mechanism is chosen, someone has to pay for the cables, substations, and transformers. The question is only which behaviour the price signal encourages in the process of doing so.
The bottom line on trajectory
The capacity tariff rate itself has been relatively stable since 2023. The total grid cost increase in 2025 was driven by Elia's transmission costs, not the capacity mechanism. Under the 2025–2028 regulatory framework, total household grid costs should settle in the €445–471 annual range.
What changes after 2028 is the more important question. The current mechanism has a structural flaw that grows in significance as renewable generation increases: it creates the wrong incentive during high-solar periods. That flaw is understood, it is being discussed at regulatory level, and the expiry of the current framework at the end of 2028 is the obvious moment to address it. Whether the replacement is a time-differentiated capacity rate, a time-of-use kWh tariff along Wallonian lines, or something else entirely will depend on the regulatory process that plays out over the next two years.
What is almost certain is that the consumer who understands the current mechanism, actively manages their peak through 2028, and then positions themselves to adapt to whatever comes next will be materially better off than the consumer who pays no attention at all. The meter is running. Watch the quarter-hour intervals — and keep an eye on what Brussels decides to do with them.
That staggering doesn't happen by accident in most households — it requires either constant attention or a system that handles it automatically. 10s does the latter: it tracks your rolling monthly peak in real time, manages your connected loads to keep that peak as low as possible, and — once this month's worst quarter-hour has already passed — switches mode to capture the negative-price windows that make dynamic pricing genuinely valuable. Two objectives, one system, no daily decisions required. The prediction mechanics that make the second part possible are explained in detail in Can you predict the next grid imbalance price?.
Sources: Vlaamse Nutsregulator (VNR/VREG), Fluvius Investment Plan 2026–2035, Elia adequacy study 2023, Flanders government December 2025 announcement, SmartPeak/VREG household data (Nov 2025, 1M+ meters), Stad Damme 2026 tariff guidance, VEB nettarief briefing Dec 2024, isolatie-info.be tariefmethodologie analysis, Trilations capacity tariff recapitulation.